1
2
3
4
5
6
7
8
9
10
11
12
13
14
15
16
17
18
19
20
21
22
23
24
25
26
27
28
29
30
31
32
33
34
35
36
37
38
39
40
41
42
43
44
45
46
47
48
49
50
51
52
53
54
55
56
57
58
59
60
61
62
63
64
65
66
67
68
69
70
71
72
73
74
75
76
77
78
79
80
81
82
83
84
85
86
87
88
89
90
91
92
93
94
95
96
97
98
99
100
101
102
103
104
105
106
107
108
109
110
111
112
113
114
115
116
117
118
119
120
121
122
123
124
125
126
127
128
129
130
131
132
133
134
135
136
137
138
139
140
141
142
143
144
145
146
147
148
149
150
151
152
153
| <template>
<div class="map-container">
<div class="map" ref="map"></div>
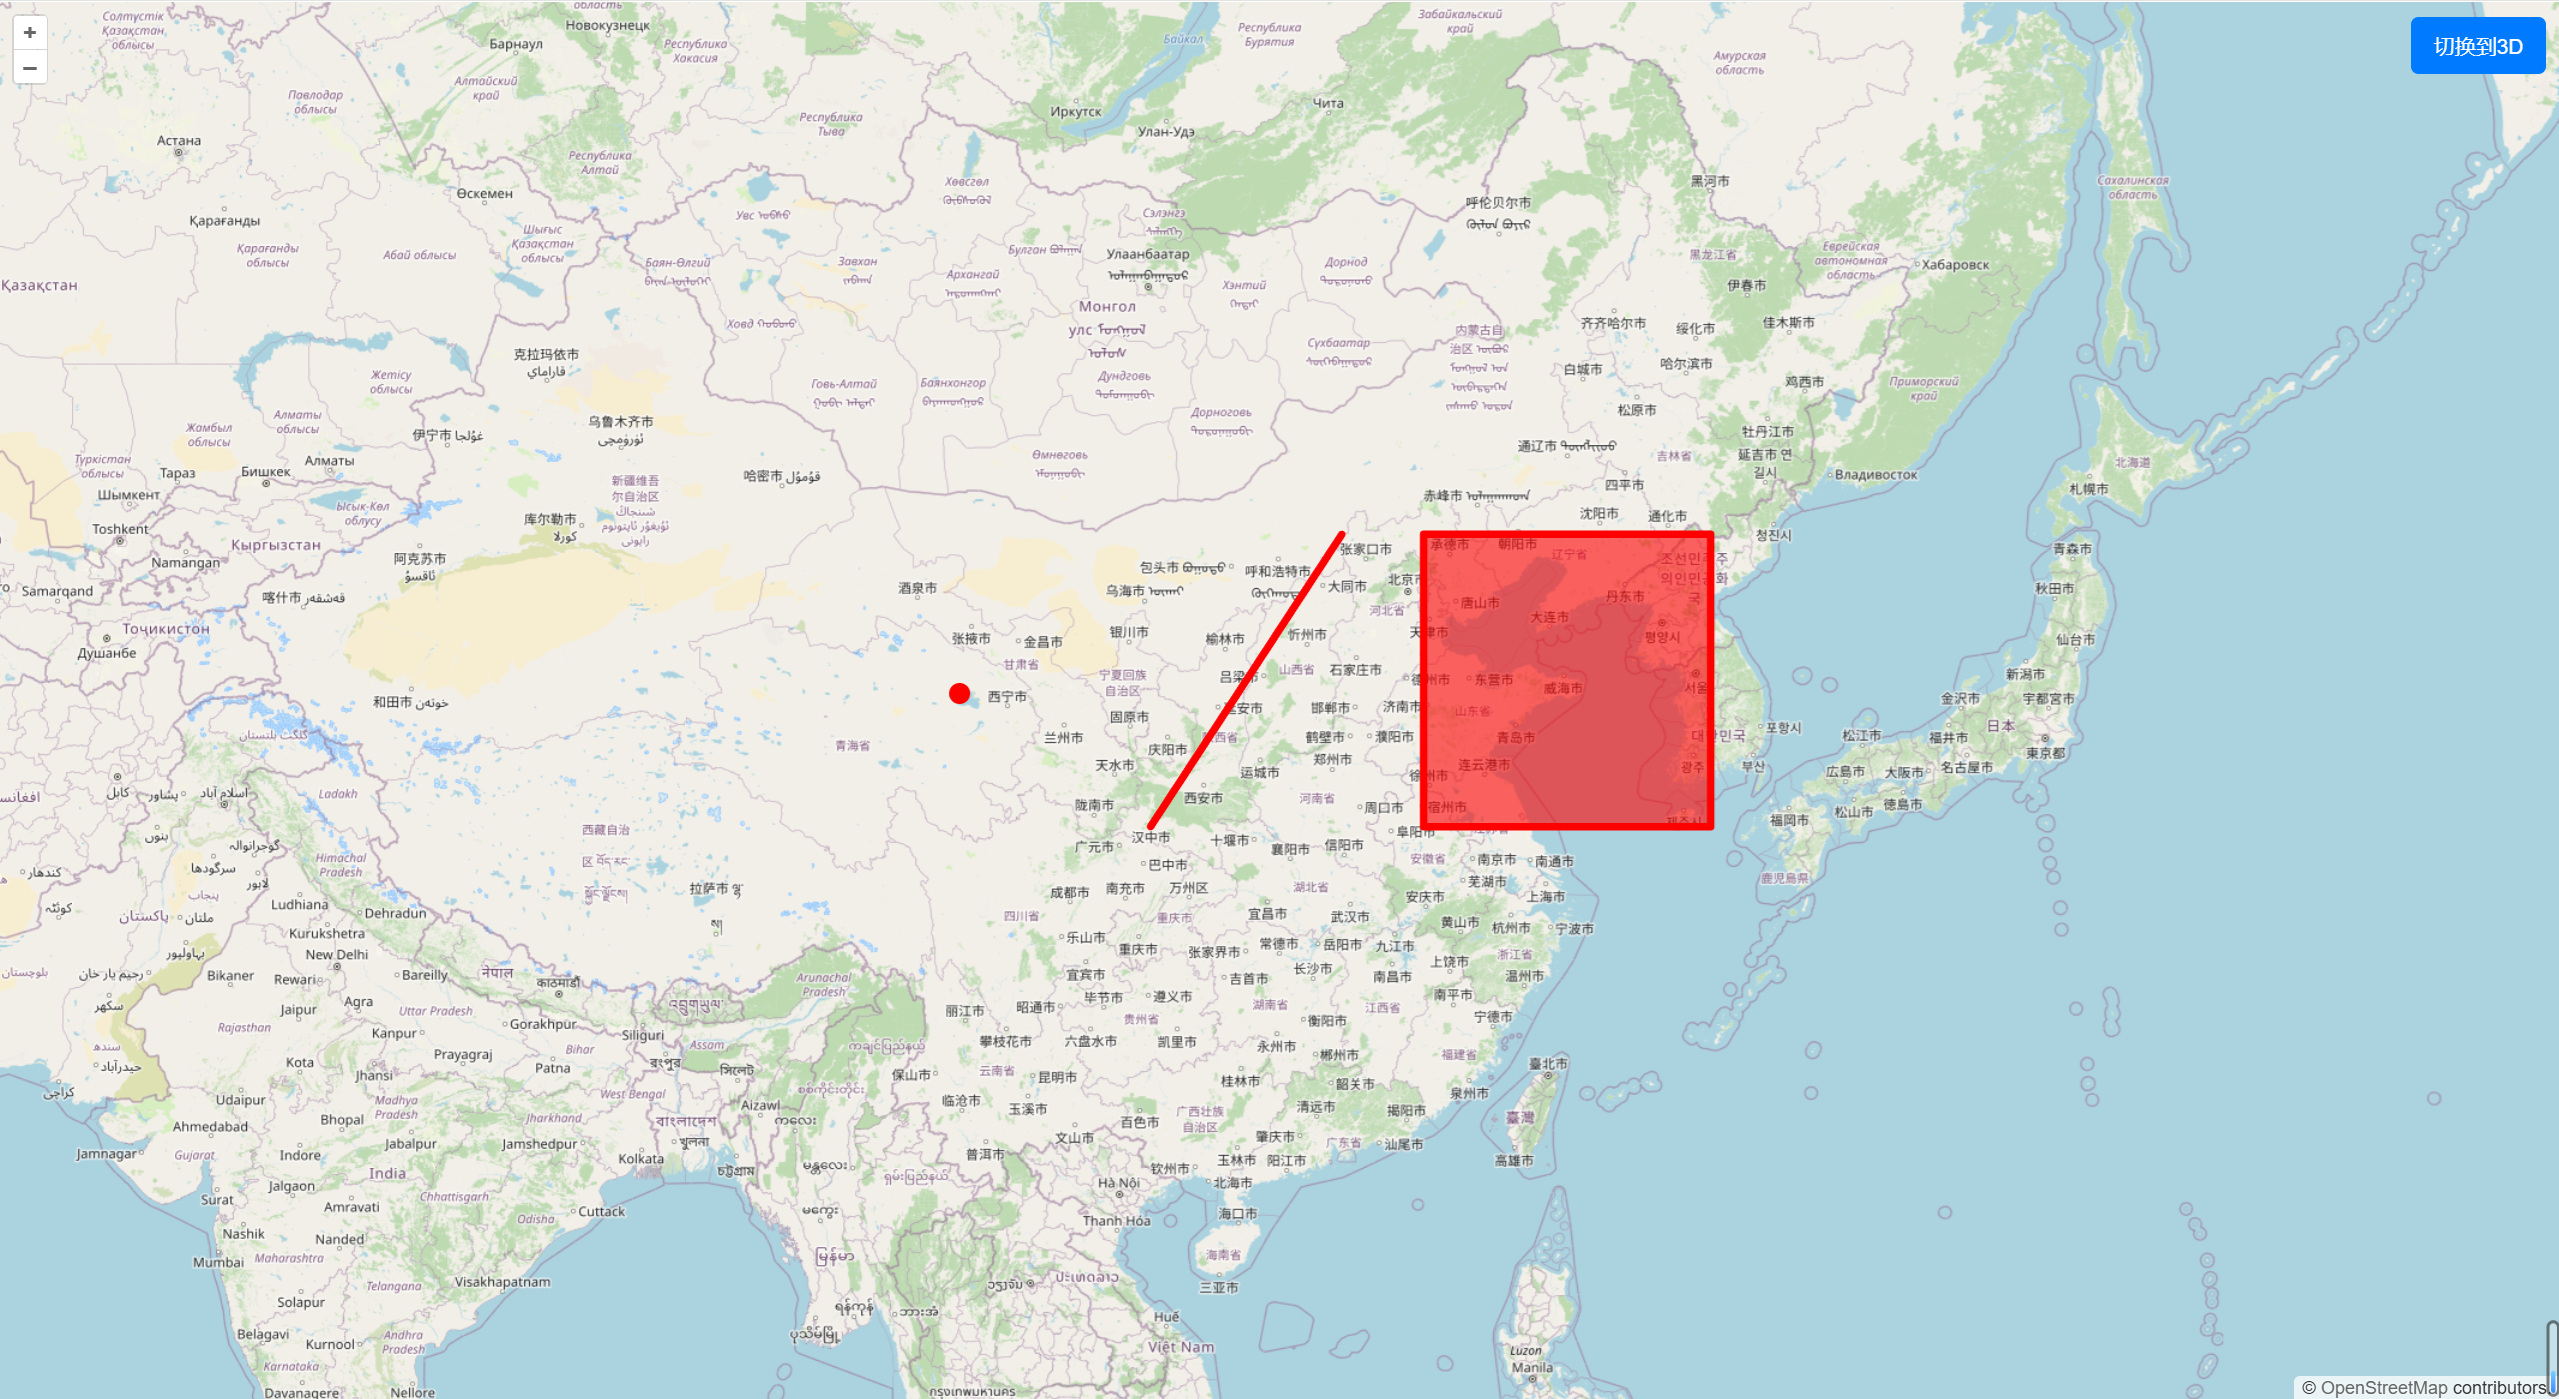
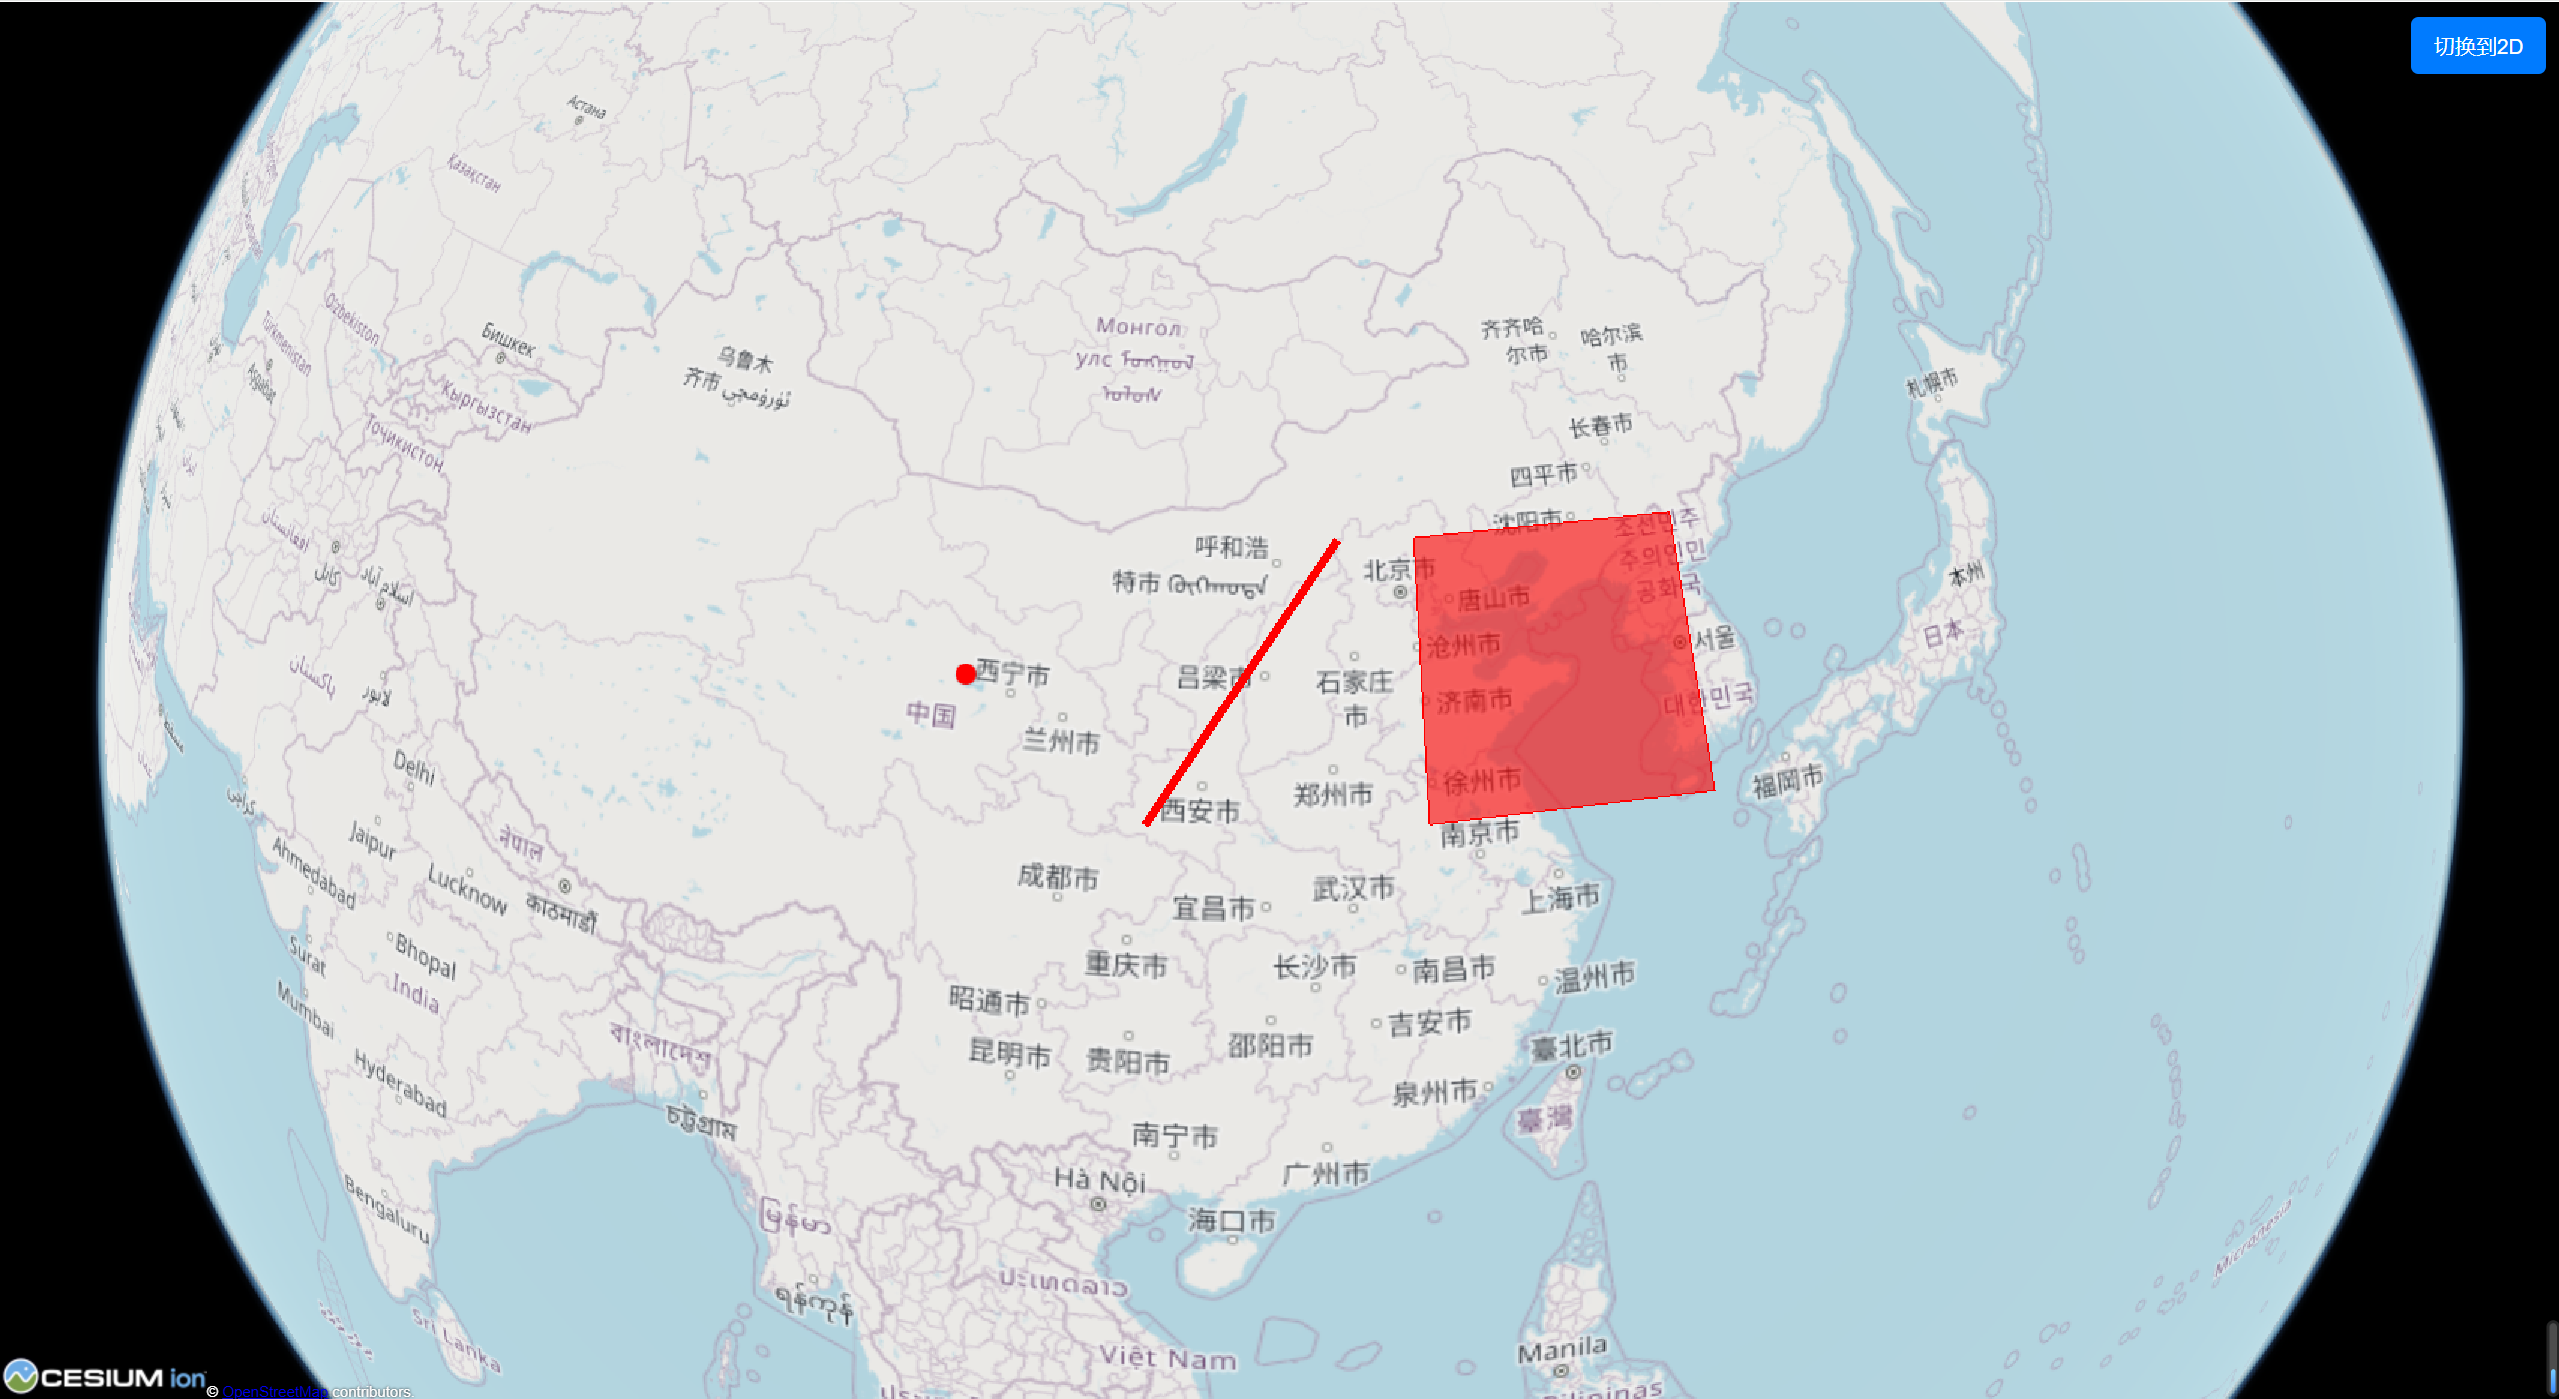
<button class="toggle-btn" @click="toggle3D">{{ is3D ? "切换到2D" : "切换到3D" }}</button>
</div>
</template>
<script>
import Map from "ol/Map";
import View from "ol/View";
import TileLayer from "ol/layer/Tile";
import OSM from "ol/source/OSM";
import { fromLonLat } from "ol/proj";
import VectorLayer from "ol/layer/Vector";
import VectorSource from "ol/source/Vector";
import Feature from "ol/Feature";
import Point from "ol/geom/Point";
import LineString from "ol/geom/LineString";
import Polygon from "ol/geom/Polygon";
import { Circle as CircleStyle, Fill, Stroke, Style } from "ol/style";
import OLCesium from 'olcs';
export default {
data() {
return {
ol2dMap: null,
ol3D: null,
is3D: false,
};
},
mounted() {
this.initMap();
},
methods: {
initMap() {
// 创建 OSM 用作底图
const rasterLayer = new TileLayer({
source: new OSM(),
});
// 创建点线面图形
const pointGeometry = new Point(fromLonLat([100, 37]));
const lineStringGeometry = new LineString([
fromLonLat([107, 33]),
fromLonLat([114, 41.5]),
]);
const polygonGeometry = new Polygon([
[
fromLonLat([117, 33]),
fromLonLat([117, 41.5]),
fromLonLat([127.5, 41.5]),
fromLonLat([127.5, 33]),
],
]);
// 创建矢量数据源,并将点线面图形作为地理要素添加到矢量数据源中
const vectorSource = new VectorSource({
features: [
new Feature({
geometry: pointGeometry
}),
new Feature({
geometry: lineStringGeometry
}),
new Feature({
geometry: polygonGeometry
}),
],
});
// 创建矢量图层,并将矢量数据源添加到矢量图层中,同时通过 style 设置样式
// 具体样式可以根据需求进行自定义,这里仅设置了填充颜色、边框颜色和边框宽度等样式。
const vectorLayer = new VectorLayer({
source: vectorSource,
style: new Style({
fill: new Fill({ color: "rgba(255, 0, 0, 0.6)" }),
stroke: new Stroke({ color: "#ff0000", width: 5 }),
image: new CircleStyle({
radius: 7,
fill: new Fill({ color: "#ff0000" }),
}),
}),
});
// 创建地图,并将 OSM 底图和矢量图层添加到地图中
this.ol2dMap = new Map({
target: this.$refs.map,
layers: [rasterLayer, vectorLayer],
view: new View({
center: fromLonLat([117, 37]),
zoom: 4,
// 设置地图的投影为 EPSG:4326,即 WGS84 地球坐标系
// 该投影可直接用于表示 WGS84 坐标系下的经纬度坐标,如 [117, 37] 表示中国上海。
// 但在高纬度的情况下,可能会出现一些问题,不太好看,如:
// 1. 地球表面被截断,无法完整地显示;
// 2. 地球表面被拉伸,无法完整地显示;
// 3. 地球表面被扭曲,无法完整地显示。
// 因此,这里使用默认的 EPSG:3857,即 Web Mercator 地球坐标系,该投影可以表示 WGS84 坐标系下的经纬度坐标,需要使用 fromLonLat 方法将经纬度坐标转换为 Web Mercator 坐标系下的坐标。
// 但不会出现上述问题,可以完整地显示地球表面。
// projection: "EPSG:4326",
}),
});
// 创建 OLCesium,并将二维地图作为参数传入
this.ol3D = new OLCesium({ map: this.ol2dMap });
},
/**
* 切换3D视图状态
* 此方法用于在当前视图状态与3D视图状态之间进行切换通过反转当前的is3D属性来改变视图状态
* 并调用ol3D对象的setEnabled方法,将新的is3D值作为参数传递进去,以启用或禁用3D视图功能
*/
toggle3D() {
// 反转当前的is3D属性,以切换视图状态
this.is3D = !this.is3D;
// 调用ol3D对象的setEnabled方法,根据当前的is3D属性值来启用或禁用3D视图功能
// true 表示启用3D视图功能,false 表示禁用3D视图功能(也就是设置为2D模式)
this.ol3D.setEnabled(this.is3D);
},
},
};
</script>
<style scoped>
.map-container {
position: relative;
width: 100%;
height: 100vh;
}
/* 必须给 .map 宽高,否则地图不会显示 */
.map {
width: 100%;
height: 100%;
}
.toggle-btn {
position: absolute;
top: 10px;
right: 10px;
padding: 10px 15px;
background-color: #007bff;
color: white;
border: none;
cursor: pointer;
font-size: 14px;
border-radius: 5px;
}
.toggle-btn:hover {
background-color: #0056b3;
}
</style>
|